- Committee on Foreign Investment in the U.S.
- Employment & Trade
- Environment
- Export Trading Company Act
- Global Competitiveness
- Industry Regulation
- Reference Information
- Trade Agreements & Negotiations
- Trade Disputes & Enforcement
- Trade Statistics
- U.S. Trade Laws
CAFTA-DR: A STATE EXPORT OVERVIEW, 2000–2004
See the CAFTA-DR Gateway for more on the Central America–Dominican Republic Free Trade Agreement.
For HTML display of CAFTA-DR export data by state, start on the TSE state export data page:
Specify any state and choose Central American Free Trade Agreement as the trade partner under "trading & economic regions."
U.S. Exports to CAFTA-DR Nations Are on the Rise
U.S. merchandise exports to the CAFTA-DR region totaled $15.7 billion in 2004—an increase of $2.2 billion above the 2000 level.
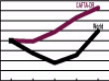
U.S. export growth to the CAFTA-DR region has outperformed overall U.S. exports. From 2000 to 2004 export shipments to the CAFTA-DR group expanded by 16.4 percent, more than three times the 4.8 percent growth of overall U.S. exports.
The CAFTA-DR region accounts for a growing share of U.S. exports to Latin America and the Caribbean. In 2004, the CAFTA-DR market accounted for more than one-fourth (26 percent) of U.S. merchandise exports to Latin America and the Caribbean, up from 23 percent in 2000.
Among the six CAFTA-DR nations, the Dominican Republic is the United States’ largest export market. The United States shipped $4.3 billion worth of merchandise to the Dominican Republic in 2004—representing 28 percent of the U.S. total to the CAFTA-DR region.
Costa Rica was the next largest export market ($3.3 billion of U.S. shipments in 2004), followed by Honduras ($3.1 billion), Guatemala ($2.5 billion), El Salvador ($1.9 billion) and Nicaragua ($592 million).
U.S. Export Growth to CAFTA-DR Countries Is Broadly Based
Merchandise exports to five of the six CAFTA-DR nations increased from 2000 to 2004, led by a 56 percent ($213 million) increase in exports to Nicaragua. Nicaragua was followed by Costa Rica (U.S. exports up 35 percent, or $858 million), Guatemala (up 34 percent, or $653 million), Honduras (up 19 percent, or $502 million), El Salvador (up 5 percent, or $93 million).
Half of the 50 states recorded 2004 export shipments to the CAFTA-DR region that exceeded a value of $100 million. Of these, seven states each posted 2004 export values to CAFTA-DR markets of more than $500 million.
Florida was the largest state exporter to the CAFTA-DR region in 2004, shipping $3.2 billion worth of merchandise (21 percent, or more than one-fifth, of the U.S. total to the region).
Florida was followed by Texas ($1.8 billion) and North Carolina ($1.7 billion), each accounting for 11 percent of U.S. exports to the CAFTA-DR group, then by Louisiana ($1.2 billion, or 7 percent of the U.S. total) and Georgia ($667 million, or 4 percent).
In dollar terms, North Carolina’s exports to the CAFTA-DR region grew the most from 2000 to 2004, increasing by $678 million. Other states that had large increases were Texas (exports to the CAFTA-DR group up $650 million), California (up $271 million), Oregon (up $232 million), and New Mexico (up $171 million).
In percentage terms, Hawaii’s exports to the CAFTA-DR group grew the fastest from 2000 to 2004, skyrocketing 8,913 percent from a modest 2000 base value of $142 thousand. Other states with rapid export growth to the CAFTA-DR region over that period were Oregon (up 663 percent from a 2000 value of $35 million), New Mexico (up 273 percent from a 2000 value of $63 million), Washington (up 251 percent from a 2000 value of $32 million) and Rhode Island (up 231 percent from a 2000 value of $9 million).
Fabric mill products is the leading manufactured export category to the CAFTA-DR group, with 2004 exports to the region of $2.6 billion (16 percent of the U.S. total).
Other top manufactured exports to the CAFTA-DR region in 2004 were computer and electronic products ($2.2 billion), apparel manufactures ($1.6 billion), chemical manufactures ($1.2 billion), and petroleum and coal products ($961 million).
Fabric mill products is the fastest-growing manufactured export category to the CAFTA-DR region. Shipments of these products rose 249 percent from $732 million in 2000 to $2.6 billion in 2004.
Other fast-growing manufactured exports to the CAFTA-DR region during the 2000-2004 period were petroleum and coal products (up 137 percent from $406 million), primary metal manufactures (up 84 percent from $93 million), and beverage and tobacco products (up 61 percent from $29 million).
The United States also exported $2.1 billion in non-manufactured products to the CAFTA-DR group in 2004. These goods accounted for 13 percent of total U.S. merchandise exports to the region. Important non-manufactured exports to the CAFTA-DR countries in 2004 included oilseeds and grains ($761 million), other agricultural products ($153 million), and oil and gas ($52 million).
States that recorded the most revenue from exports of non-manufactured products to the CAFTA-DR countries in 2004 were Louisiana ($733 million), Pennsylvania ($113 million), Texas ($105 million), Florida ($90 million), and California ($73 million).
Small and Medium-Sized Companies Are Key Players in U.S. Exports to The CAFTA-DR Region
In 2002 (latest data available) 13,557 small and medium-sized enterprises (enterprises with fewer than 500 employees) exported to the CAFTA-DR countries. SMEs were responsible for an estimated 37 percent of U.S. merchandise exports to the CAFTA-DR group—sharply higher than the 26 percent SME share of total U.S. merchandise exports.
Latest available data show that SMEs generate 70 percent of U.S. merchandise exports to Nicaragua, 47 percent of shipments to Guatemala, 44 percent of exports to the Dominican Republic, 35 percent of exports to El Salvador, 33 percent of shipments to Honduras, and 22 percent of exports to Costa Rica.
Thousands of SMEs export goods to the individual CAFTA -DR nations. A total of 4,723 SMEs exported to the Dominican Republic in 2002. Comparable 2002 SME exporter figures for the other CAFTA-DR nations: Guatemala 4,308, Costa Rica 4,278, Honduras 2,842, El Salvador 2,572, and Nicaragua 1,204. (Because any given firm can export to multiple nations, exporter counts for individual countries cannot be summed to reach the CAFTA-DR group total).
Charts and Tables
U.S. Exports to CAFTA-DR Nations in 2004 Were 16 Percent Higher Than in 2000 (PDF)
|
25 States Exported $100 Million or More to CAFTA-DR Markets in 2004 (PDF) |
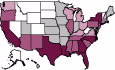
Seven of the Top Ten State Exporters to the CAFTA-DR Region Are Southern States (PDF)
|

The Dominican Republic Leads CAFTA-DR Markets for U.S. SMEs (PDF)
|
U.S. Exports to CAFTA-DR Markets Are Growing Faster Than Total U.S. Exports (PDF) |
Data Notes on the Origin of Movement Series
In this report the terms “CAFTA-DR,” “CAFTA-DR region,” “CAFTA-DR partners,” “CAFTA-DR markets,” “CAFTA-DR countries,” and “CAFTA-DR nations” are used interchangeably and refer to the following group of export destinations: Costa Rica, the Dominican Republic, El Salvador, Guatemala, Honduras, and Nicaragua. The terms do not refer to the Central America–Dominican Republic Free Trade Agreement itself. Figures for SMEs are from the Exporter Data Base, maintained by the U.S. Department of Commerce. Source: Origin of Movement (OM) State Export Series, Bureau of the Census, U.S. Department of Commerce. The OM series allocates exports to states based on transportation origin, i.e., the state from which goods begin their journey to the port (or other point) of exit from the United States. The transportation origin of exports is not always the same as the location where the goods were produced. Thus, conclusions about “export production” in a state should not be made solely on the basis of the OM state export figures. |