 Travel and Tourism Indicators
 General Travel Data
- Travel Trade Balance
- International Travelers to USA
- International Traveler Spending in USA
- Employment
- Industry Output
- Travel Promotion Fees Collected
- Airport Experience Ratings of Passport Control Personnel
- Airport Processing Times
- Airport Processing Times Assessment
 Visa Wait Times
 Other Travel Info
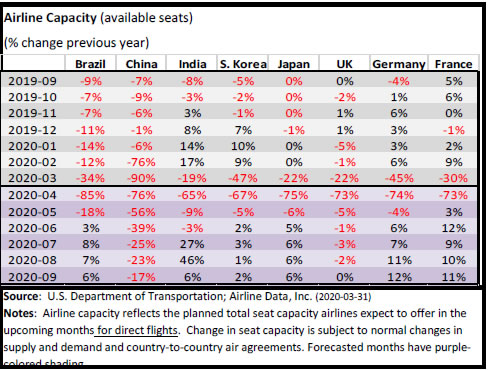
Airline Capacity
This graph shows the monthly changes in airline capacity for Brazil, China, India, and for all 200 plus countries. Airline capacity reflects the planned total seat capacity airlines expect to offer in the upcoming months. Change in seat capacity is subject to normal changes in supply and demand and country-to-country air agreements. Changes in airline capacity may reflect changes in any or all of the following elements: 1) changes in traveler volume FROM the origin country; 2) changes in traveler volume from other foreign countries passing through the origin country airports; and 3) changes in traveler volume of U.S. residents returning to the U.S. Airline capacity is a continuously moving target. Changes shown here are at one point in time - mid-month for the current actual month.


The International Trade Administration, U.S. Department of Commerce, manages this global trade site to provide access to ITA information on promoting trade and investment, strengthening the competitiveness of U.S. industry, and ensuring fair trade and compliance with trade laws and agreements. External links to other Internet sites should not be construed as an endorsement of the views or privacy policies contained therein. This site contains PDF documents. A PDF reader is available from Adobe Systems Incorporated.
